Texas '25 Student Profile

43
States
Represented

56
Countries
Represented

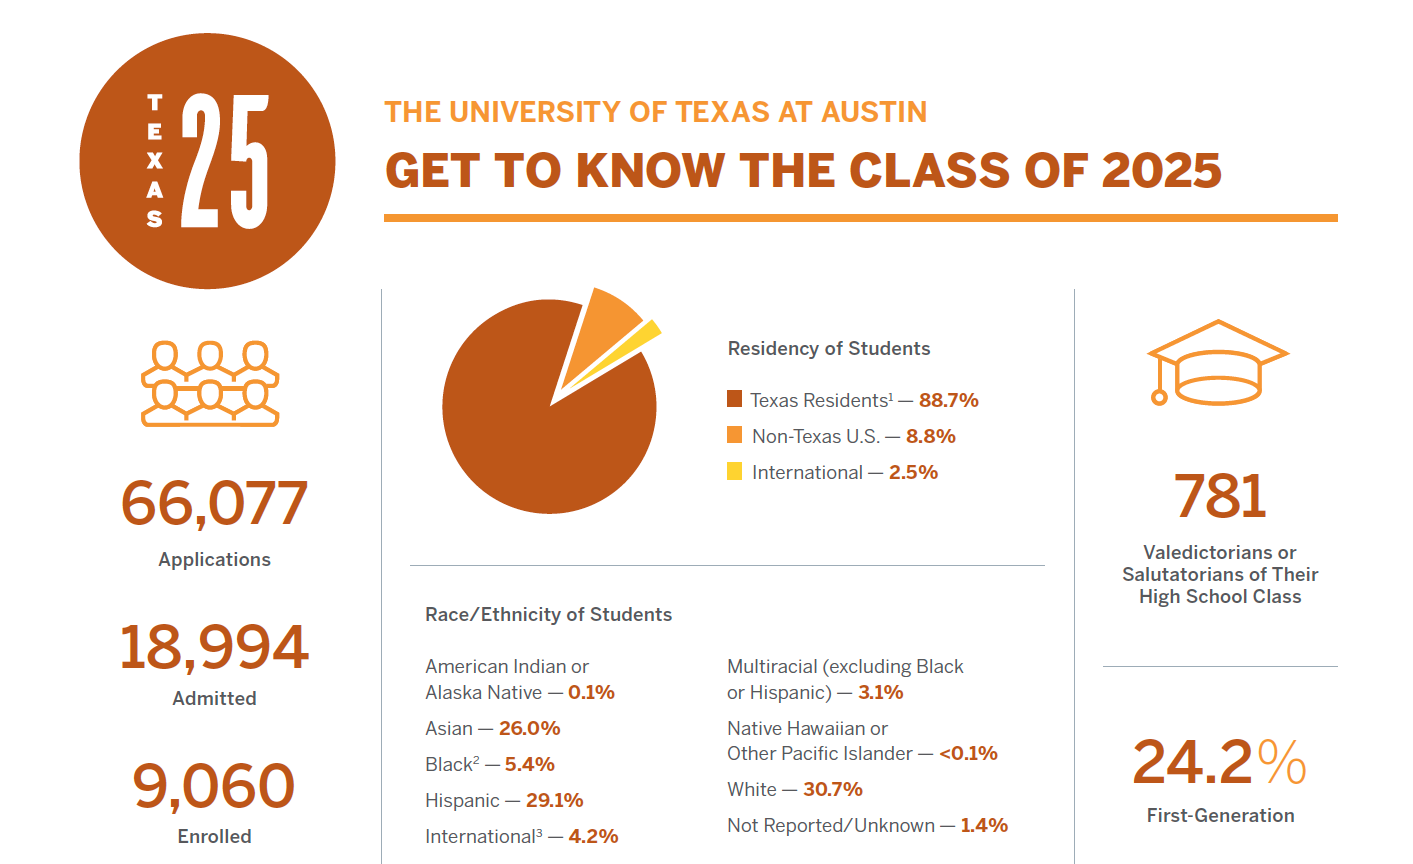
24.2%
Students are in their family’s
first generation to attend college
59.3%
Female
40.7%
Male
- Natural Sciences
- Liberal Arts
- Engineering
- Business
- Communication

781
Valedictorians or Salutatorians
of their high school class
9,060
Enrolled
1,117
Number of Texas high schools represented
1,803
Number of high schools represented

top
6%
Texas high school graduates
automatically admitted
66,077
Applications
18,994
Admitted (including PACE)
- American Indian or
Alaska Native — 0.1% - Asian — 26.0%
- Black2 — 5.4%
- Hispanic — 29.1%
- International3 — 4.2%
- Multiracial
(excluding Black or Hispanic) — 3.1% - Native Hawaiian or
Other Pacific Islander — < 0.1% - White — 30.7%
- Not Reported/Unknown — 1.4%

Student Profile Texas 25
View a fact sheet that includes a brief overview of student demographics, graduation rates, majors, and other information about the university's students.
Enrollment Management | The University of Texas at Austin
12th Class Day Numbers. Fall 2021 (PACE Included). Admission rates are based on the total number of completed applications. The information is accurate as of September 17, 2021.
SAT/ACT test scores were not a required component for application to the Class of 2025.
1The residency of first-time undergraduates is defined by the Texas Administrative Code, Title 19, Part 1, Chapter 21, Subchapter B, Rule 21.24.
2Black includes both “Black or African American Alone” and “Black or African American Multiracial (excluding Hispanic)”.
3International is included for reporting purposes in the state of Texas.